
| General Statistics |
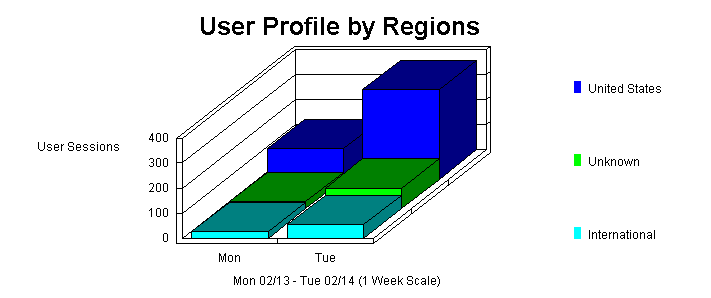
The User Profile by Regions graph identifies the general location of the visitors to your Web site. The General Statistics table includes statistics on the total activity for this web site during the designated time frame.
 |
|
|
|
| Date & Time This Report was Generated | Tuesday February 14, 2006 - 15:03:41 |
| Timeframe | 02/13/06 16:00:06 - 02/14/06 15:03:33 |
| Number of Hits for Home Page | 388 |
| Number of Successful Hits for Entire Site | 59,871 |
| Number of Page Views (Impressions) | 59,797 |
| Number of Document Views | 720 |
| Number of User Sessions | 667 |
| User Sessions from United States | 71.96% |
| International User Sessions | 11.84% |
| User Sessions of Unknown Origin | 16.19% |
| Average Number of Hits Per Day | 59,871 |
| Average Number of Page Views Per Day | 64,796 |
| Average Number of User Sessions Per Day | 667 |
| Average User Session Length | 00:06:38 |
| Number of Unique Users | 537 |
| Number of Users Who Visited Once | 389 |
| Number of Users Who Visited More Than Once | 148 |
| Most Requested Pages |
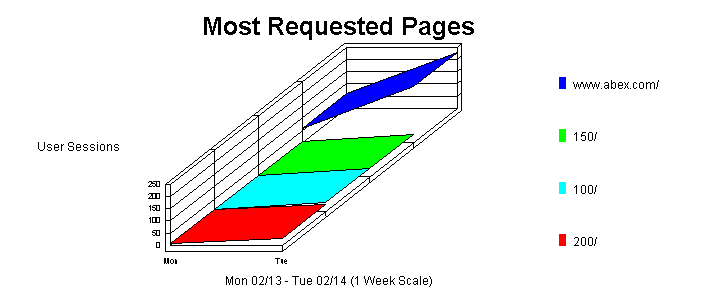
This section identifies the most popular web site pages and how often they were accessed. The average time a user spends viewing a page is also indicated in the table.
 |
|
|
|||||
|
|
|
|
|
|
|
|
|
Abex Display Systems http://www.abex.com/ |
|
|
|
|
|
|
Abex 150 Banner Stand, Banner Stand, Retractable Banner Stand, Banner Stand Sign http://www.abex.com/products/ 150/ |
|
|
|
|
|
|
Abex 100 Tabletop Pop Up Display, Table Top Display, Table Top Trade Show Displa http://www.abex.com/products/ 100/ |
|
|
|
|
|
|
Abex 200 Pop-up Display, Pop Up Display, Pop Up Portable Trade Show Display, Pop http://www.abex.com/products/ 200/ |
|
|
|
|
|
|
Abex 250 Pop-up Display, Portable Display, Portable Trade Show Display, Pop Up P http://www.abex.com/products/ 250/ |
|
|
|
|
|
|
Abex - 900 Signature Series http://www.abex.com/products/ 900s/ |
|
|
|
|
|
|
Abex - 300 Popup System http://www.abex.com/products/ 300/ |
|
|
|
|
|
|
Register Here http://www.abex.com/expo/ blast/ |
|
|
|
|
|
|
Abex 200SL Self-locking Pop-up Display, Pop Up Display, Pop Up Exhibit, Portable http://www.abex.com/products/ 200SL/ |
|
|
|
|
|
|
Abex - 600 MultiConnect Panel System http://www.abex.com/products/ 600/ |
|
|
|
|
|
|
Sub Total For the Page Views Above |
|
|
|
|
|
|
Total For the Log File |
|
|
|
|
| Dynamic Pages & Forms |
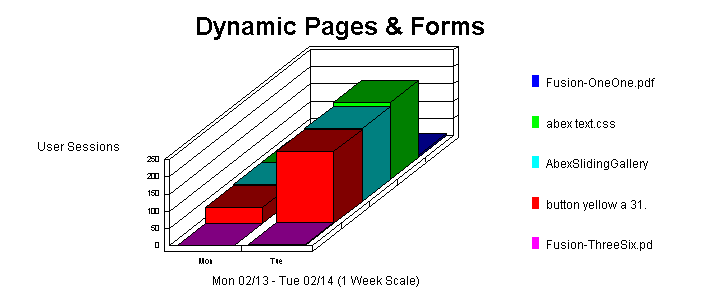
This section identifies the most popular dynamic pages and forms executed by the server. WebTrends counts any line with a Post command or a Get command with a "?" as a dynamic page, and shows only successful hits.
 |
|
|
||||
|
|
|
|
|
|
|
|
http://www.abex.com/fusion/ Fusion-OneOne.pdf |
|
|
|
|
|
http://www.abex.com/ abex_text.css |
|
|
|
|
|
http://www.abex.com/images/ misc/AbexSlidingGallery.swf |
|
|
|
|
|
http://www.abex.com/images/ navigation/sidebar/ button_yellow_a_31.gif |
|
|
|
|
|
http://www.abex.com/fusion/ Fusion-ThreeSix.pdf |
|
|
|
|
|
http://www.abex.com/images/ navigation/sidebar/ button_yellow_a_28.gif |
|
|
|
|
|
http://www.abex.com/images/ navigation/sidebar/ button_yellow_a_20.gif |
|
|
|
|
|
http://www.abex.com/images/ navigation/navbar_1_06.gif |
|
|
|
|
|
http://www.abex.com/images/ navigation/sidebar/ button_yellow_a_21.gif |
|
|
|
|
|
http://www.abex.com/images/ navigation/sidebar/ button_yellow_a_22.gif |
|
|
|
| Most Active Countries |
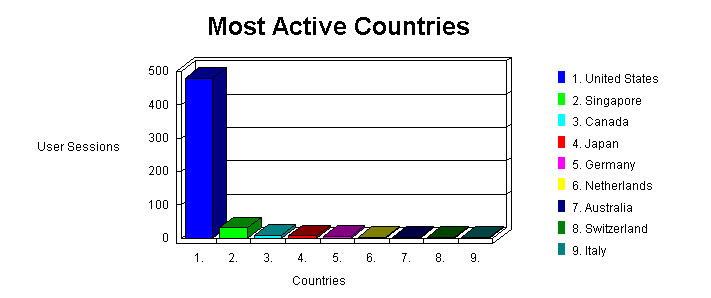
This section identifies the top locations of the visitors to the site by country. The country of the user is determined by the suffix of their domain name. Use this information carefully because this information is based on where the domain name of the visitor is registered, and may not always be an accurate identifier of the actual geographic location of this visitor. For example, while a vast majority of .com domain names are from the United States, there is a small minority of domain names that exist outside of the United States.
 |
|
|
||
|
|
|
|
|
|
United States |
|
|
|
Singapore |
|
|
|
Canada |
|
|
|
Japan |
|
|
|
Germany |
|
|
|
Netherlands |
|
|
|
Australia |
|
|
|
Switzerland |
|
|
|
Italy |
|
|
|
China |
|
|
|
Total |
|
| North American States and Provinces |
This section breaks down web site activity to show which of the North American States and Provinces were the most active on the site. This information is based on where the domain name of the visitor is registered, and may not always be an accurate representation of the actual geographic location of this visitor. This information can only be displayed if reverse DNS lookups have been performed.
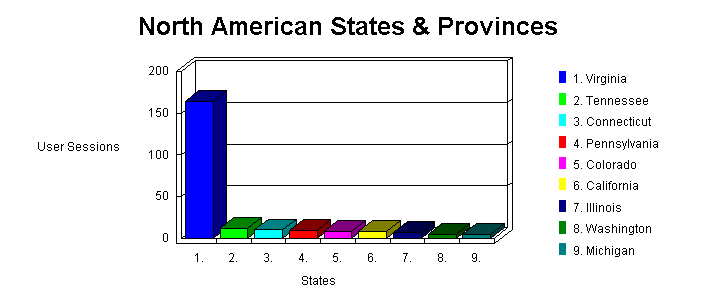 |
|
|
||
|
|
|
|
|
|
Virginia |
|
|
|
Tennessee |
|
|
|
Connecticut |
|
|
|
Pennsylvania |
|
|
|
Colorado |
|
|
|
California |
|
|
|
Illinois |
|
|
|
Washington |
|
|
|
Michigan |
|
|
|
Massachusetts |
|
|
|
Total For the States Above |
|
| Most Active Cities |
This section further breaks down the site's activity to show which cities were the most active on the site. This information is based on where the domain name of the visitor is registered, and may not always be an accurate representation of the actual geographic location of this visitor. This information can only be displayed if reverse DNS lookups have been performed.
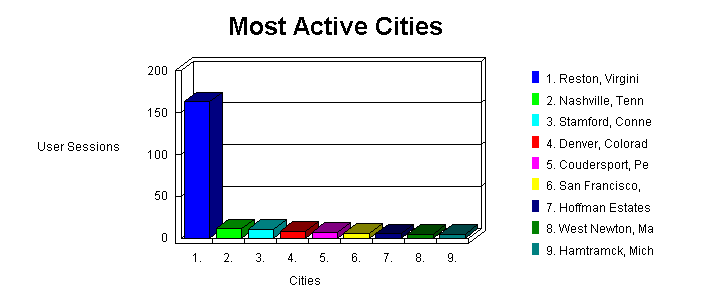 |
|
|
||
|
|
|
|
|
|
Reston, Virginia, United States |
|
|
|
Nashville, Tennessee, United States |
|
|
|
Stamford, Connecticut, United States |
|
|
|
Denver, Colorado, United States |
|
|
|
Coudersport, Pennsylvania, United States |
|
|
|
San Francisco, California, United States |
|
|
|
Hoffman Estates, Illinois, United States |
|
|
|
West Newton, Massachusetts, United States |
|
|
|
Hamtramck, Michigan, United States |
|
|
|
Redmond, Washington, United States |
|
|
|
Total For the Cities Above |
|
| Most Active Organizations |
This section identifies the companies or organizations that accessed the site the most often.
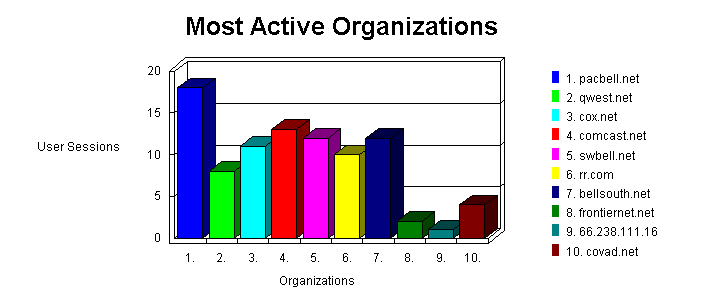 |
|
|
||||
|
|
|
|
|
|
|
|
pacbell.net |
|
|
|
|
|
Qwest Communications qwest.net |
|
|
|
|
|
D. A. Cox Enterprises Incorporated cox.net |
|
|
|
|
|
comcast.net |
|
|
|
|
|
swbell.net |
|
|
|
|
|
EXCALIBUR Group A Time Warner Company rr.com |
|
|
|
|
|
bellsouth.net |
|
|
|
|
|
Frontier Information Technologies INC frontiernet.net |
|
|
|
|
|
66.238.111.16 |
|
|
|
|
|
covad.net |
|
|
|
|
|
Sub Total For Companies Above |
|
|
|
|
|
Total For the Log File |
|
|
|
| Organization Breakdown |
This section provides a breakdown by types of organizations (.com, .net, .edu, .org, .mil, and .gov.) This information can only be displayed if reverse DNS lookups have been performed, and the percentages refer to the total of hits for which the organization type can be determined (some IPs cannot be resolved to a domain, and therefore an organization type cannot be determined).
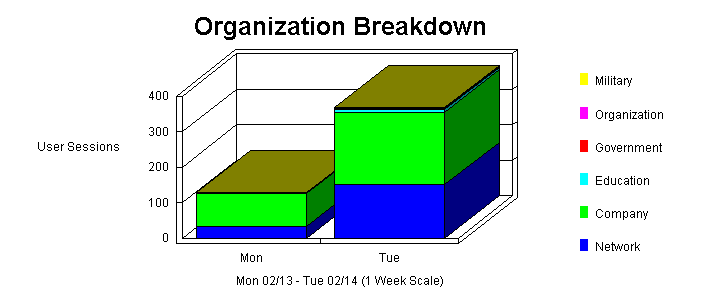 |
|
|
||||
|
|
|
|
|
|
|
|
Network |
|
|
|
|
|
Company |
|
|
|
|
|
Education |
|
|
|
|
|
Government |
|
|
|
|
|
Organization |
|
|
|
|
|
Military |
|
|
|
|
|
Total for Known Organization Types |
|
|
|
| Summary of Activity for Report Period |
This section outlines general server activity, comparing the level of activity on weekdays and weekends. The Average Number of Users and Hits on Weekdays are the averages for each individual week day. The Average Number of Users and Hits for Weekends groups Saturday and Sunday together. Values in the table do not include erred hits.
|
|
|
| Average Number of Users per day on Weekdays | 333 |
| Average Number of Hits per day on Weekdays | 29,935 |
| Average Number of Users for the entire Weekend | 0 |
| Average Number of Hits for the entire Weekend | 0 |
| Most Active Day of the Week | Tue |
| Least Active Day of the Week | Sun |
| Most Active Day Ever | February 14, 2006 |
| Number of Hits on Most Active Day | 50,959 |
| Least Active Day Ever | February 13, 2006 |
| Number of Hits on Least Active Day | 8,912 |
| Most Active Hour of the Day | 12:00-12:59 |
| Least Active Hour of the Day | 03:00-03:59 |
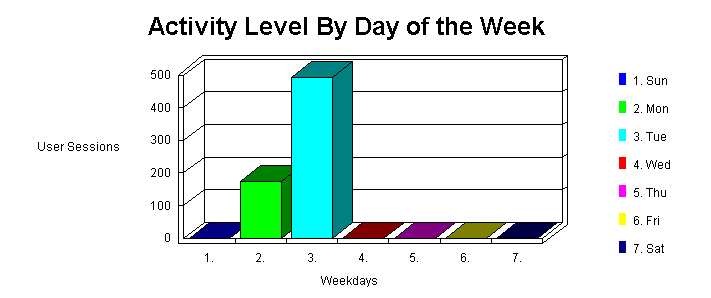
| Activity Level by Day of the Week |
This section shows the activity for each day of the week for the report period (i.e. if there are two Mondays in the report period, the value presented is the sum of all hits for both Mondays.) Values in the table do not include erred hits.
 |
|
|
||||
|
|
|
|
|
|
|
|
Sun |
|
|
|
|
|
Mon |
|
|
|
|
|
Tue |
|
|
|
|
|
Wed |
|
|
|
|
|
Thu |
|
|
|
|
|
Fri |
|
|
|
|
|
Sat |
|
|
|
|
|
Total Weekdays |
|
|
|
|
|
Total Weekend |
|
|
|
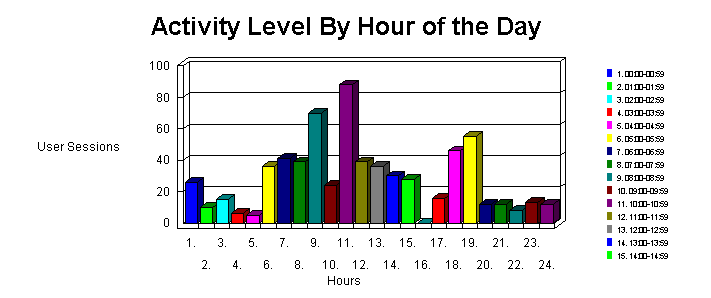
| Activity Level by Hour of the Day |
This section shows the most and the least active hour of the day for the report period. The second table breaks down activity for the given report period to show the average activity for each individual hour of the day (if there are several days in the report period, the value presented is the sum of all hits during that period of time for all days). All times are referenced to the location of the system running the analysis.
 |
|
|
|||
|
|
|
|
|
| 00:00-00:59 |
|
|
|
| 01:00-01:59 |
|
|
|
| 02:00-02:59 |
|
|
|
| 03:00-03:59 |
|
|
|
| 04:00-04:59 |
|
|
|
| 05:00-05:59 |
|
|
|
| 06:00-06:59 |
|
|
|
| 07:00-07:59 |
|
|
|
| 08:00-08:59 |
|
|
|
| 09:00-09:59 |
|
|
|
| 10:00-10:59 |
|
|
|
| 11:00-11:59 |
|
|
|
| 12:00-12:59 |
|
|
|
| 13:00-13:59 |
|
|
|
| 14:00-14:59 |
|
|
|
| 15:00-15:59 |
|
|
|
| 16:00-16:59 |
|
|
|
| 17:00-17:59 |
|
|
|
| 18:00-18:59 |
|
|
|
| 19:00-19:59 |
|
|
|
| 20:00-20:59 |
|
|
|
| 21:00-21:59 |
|
|
|
| 22:00-22:59 |
|
|
|
| 23:00-23:59 |
|
|
|
|
|
|
|
|
|
|
|
|
|
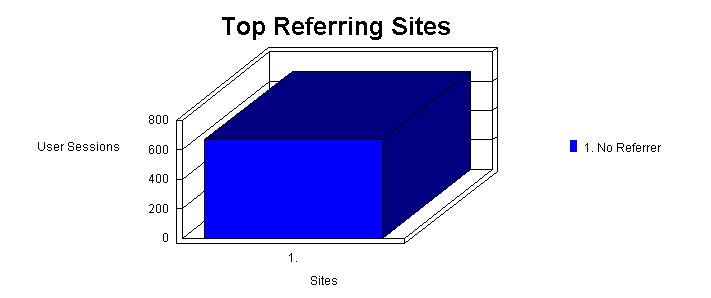
| Top Referring Sites |
This section identifies the domain names or numeric IP addresses with links to the site. This information will only be displayed if your server is logging this information.
 |
|
|
||
|
|
|
|
|
|
No Referrer |
|
|
|
Sub Total for the Referring Sites Above |
|
|
|
Total for the Log File |
|
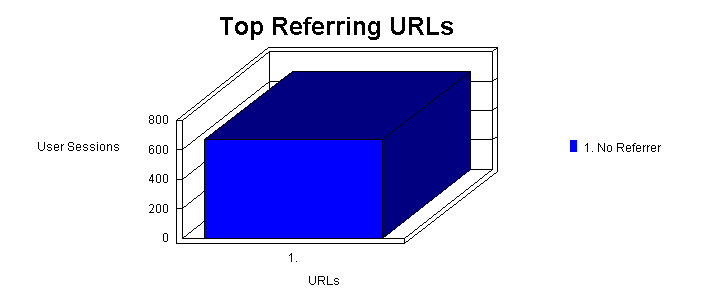
| Top Referring URLs |
This section provides the full URLs of the sites with links to the site. This information will only be displayed if your server is logging the referrer information.
 |
|
|
||
|
|
|
|
|
|
No Referrer |
|
|
|
Sub Total for the Referrers Above |
|
|
|
Total for the Log File |
|
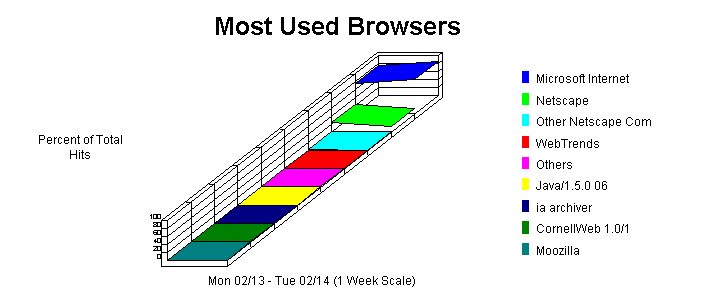
| Most Used Browsers |
This section identifies the most popular WWW Browsers used by visitors to the site. This information will only be displayed if your server is logging the browser/platform information.
 |
|
|
||||
|
|
|
|
|
|
|
|
Microsoft Internet Explorer |
|
|
|
|
|
Netscape |
|
|
|
|
|
Other Netscape Compatible |
|
|
|
|
|
WebTrends |
|
|
|
|
|
Others |
|
|
|
|
|
Java/1.5.0_06 |
|
|
|
|
|
ia_archiver |
|
|
|
|
|
CornellWeb 1.0/1 |
|
|
|
|
|
Moozilla |
|
|
|
|
|
msnbot/1.0 ( http://search.msn.com/msnbot.htm) |
|
|
|
|
|
Total For Browsers Above |
|
|
|
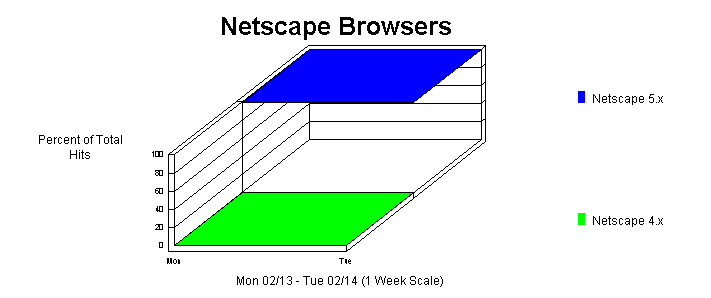
| Netscape Browsers |
This section gives you a breakdown of the various versions of Netscape browsers that visitors to the site are using.
 |
|
|
||||
|
|
|
|
|
|
|
|
Netscape 5.x |
|
|
|
|
|
Netscape 4.x |
|
|
|
|
|
Total For Browsers Above |
|
|
|
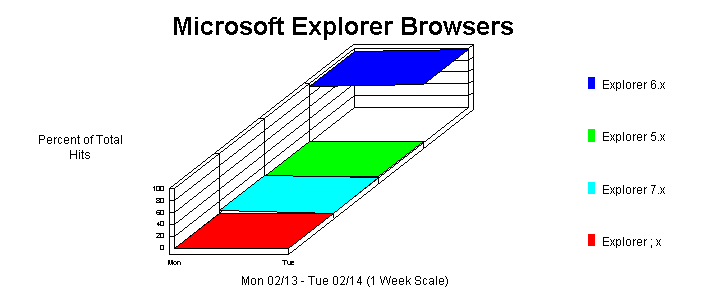
| Microsoft Explorer Browsers |
This section gives you a breakdown of the various versions of Microsoft Explorer browsers that visitors to the site are using.
 |
|
|
||||
|
|
|
|
|
|
|
|
Explorer 6.x |
|
|
|
|
|
Explorer 5.x |
|
|
|
|
|
Explorer 7.x |
|
|
|
|
|
Explorer ; x |
|
|
|
|
|
Total For Browsers Above |
|
|
|
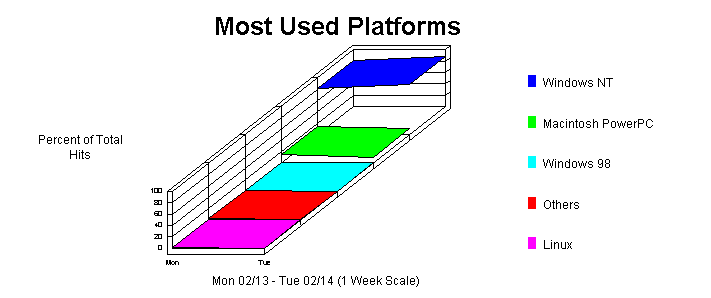
| Most Used Platforms |
This section identifies the operating systems most used by the visitors to the site.
 |
|
|
||||
|
|
|
|
|
|
|
|
Windows NT |
|
|
|
|
|
Macintosh PowerPC |
|
|
|
|
|
Windows 98 |
|
|
|
|
|
Others |
|
|
|
|
|
Linux |
|
|
|
|
|
Total For Platforms Above |
|
|
|

This report was generated by WebTrends.